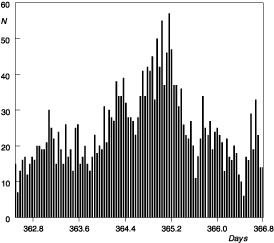
| Figure 3 DISTRIBUTION OF INTERVALS BETWEEN RECURRENCE OF HISTOGRAMS SHOWING YEARLY PERIODICITY |
|||||||||
| The distribution of time intervals between recurrence of histograms of similar shape shows periodicities associated with the astronomical cycles of day, month, and year. Here, histograms plotted from 60 results of 6-second measurements of alpha activity of a Pu-239 preparation show sharp extremes after 364.4, 365.2, and 366.6 days. Source: Courtesy of Shnoll et al., 1998. Uspekhi Fisicheskikh Nauk, Vol. 41, No. 10. |
 |
||||||||
|
|||||||||